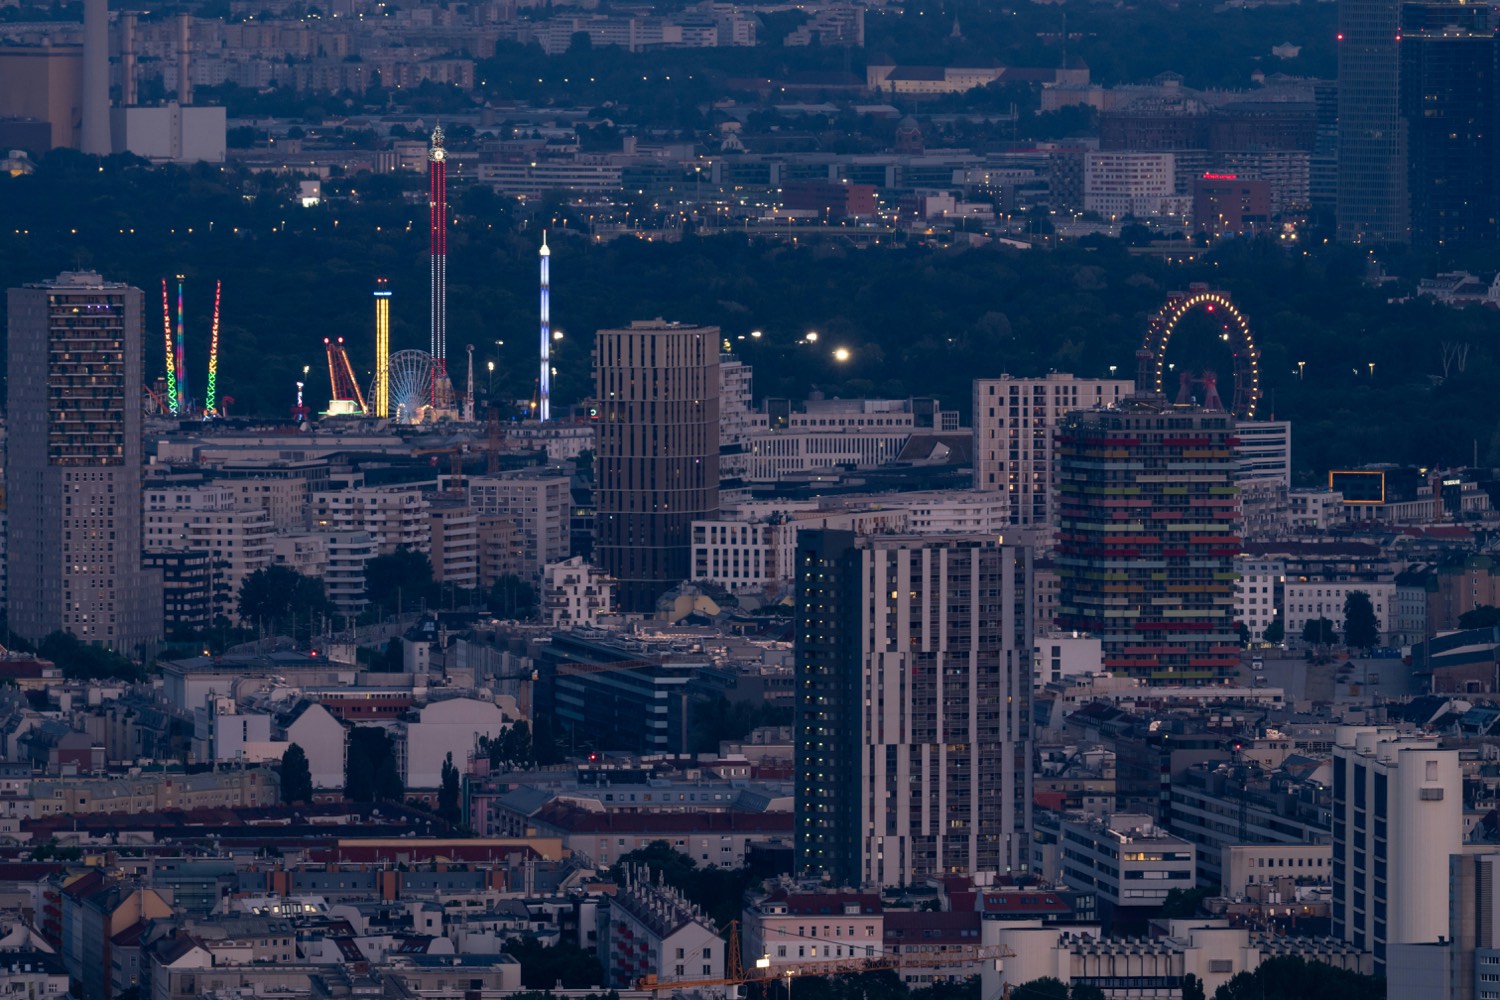
- Vienna-wide: 6,200 €/m² today → 6,978 to 7,365 €/m² in 2030 – rates derived from institutional forecasts and migration data.
- Strongest movement where entry price and development land meet: Favoriten, Donaustadt, Brigittenau.
- Every assumption open – verifiable on the map, the forecast page and in the future calculator.
1. The calculation path
Each district starts at its demo-data asking median and grows for four years at a scenario-specific annual rate: price 2030 = price today × (1 + rate)⁴. District rates follow a documented logic: low entry prices on growth axes react strongest to demand surges; fully developed high-price areas react weakest; green and waterside locations get a bonus in the climate scenario.
2. The city under three futures
Vienna-wide: 6,200 €/m² today → 6,978 €/m² (baseline, +3.0% p.a. from institutional forecasts), 7,365 €/m² (migration pressure, +4.4%) or 7,087 €/m² (climate stress, +3.4%) in 2030. The distribution is the interesting part:
| District | Today | Baseline | Migration | Climate |
|---|---|---|---|---|
| 1100 Favoriten | 4,350 | 4,972 | 5,308 | 5,069 |
| 1110 Simmering | 4,200 | 4,746 | 5,028 | 4,820 |
| 1200 Brigittenau | 4,900 | 5,536 | 5,866 | 5,645 |
| 1220 Donaustadt | 5,280 | 6,059 | 6,467 | 6,248 |
| 1010 Innere Stadt | 10,800 | 11,968 | 12,538 | 12,155 |
All 23 districts, switchable live: forecast page and map (“Forecast 2030” layer).
“A score sorts attention, not portfolios.”From the investment-score methodology
3. What this means for investing – and what not
In all three futures, the strongest calculated movement sits where entry price, yield and development land come together: Favoriten, Donaustadt, Brigittenau, Simmering, Floridsdorf. That is exactly what the investment score captures – a transparent formula of affordability, initial yield, scenario dynamics and demand momentum.
4. A worked example
70 m² in Favoriten: today ≈ €304,500 (market median). In 2030: ≈ €348,000 (baseline) / ≈ €371,500 (migration) / ≈ €355,000 (climate). Buying today and selling in 2030 under the migration scenario would mean ≈ €67,000 appreciation before costs and taxes – ≈ €47,000 after simplified ImmoESt (30%). The same calculation with your own assumptions: future calculator →
Conclusion
The most honest answer to “What will apartments cost in 2030?” is an open calculation with several futures. Whoever sees the assumptions can disagree – and exactly that separates analysis from astrology.
Source structure
- Wohni researched reference values – asking medians and scenario assumptions for all 23 districts
- Statistics Austria – house price index, population (official context)
- OeNB – residential property fundamentals indicator (official context)
- City of Vienna – urban development areas (official context)
- UNHCR/BMI – migration context (official context)
- GeoSphere Austria – climate context (official context)