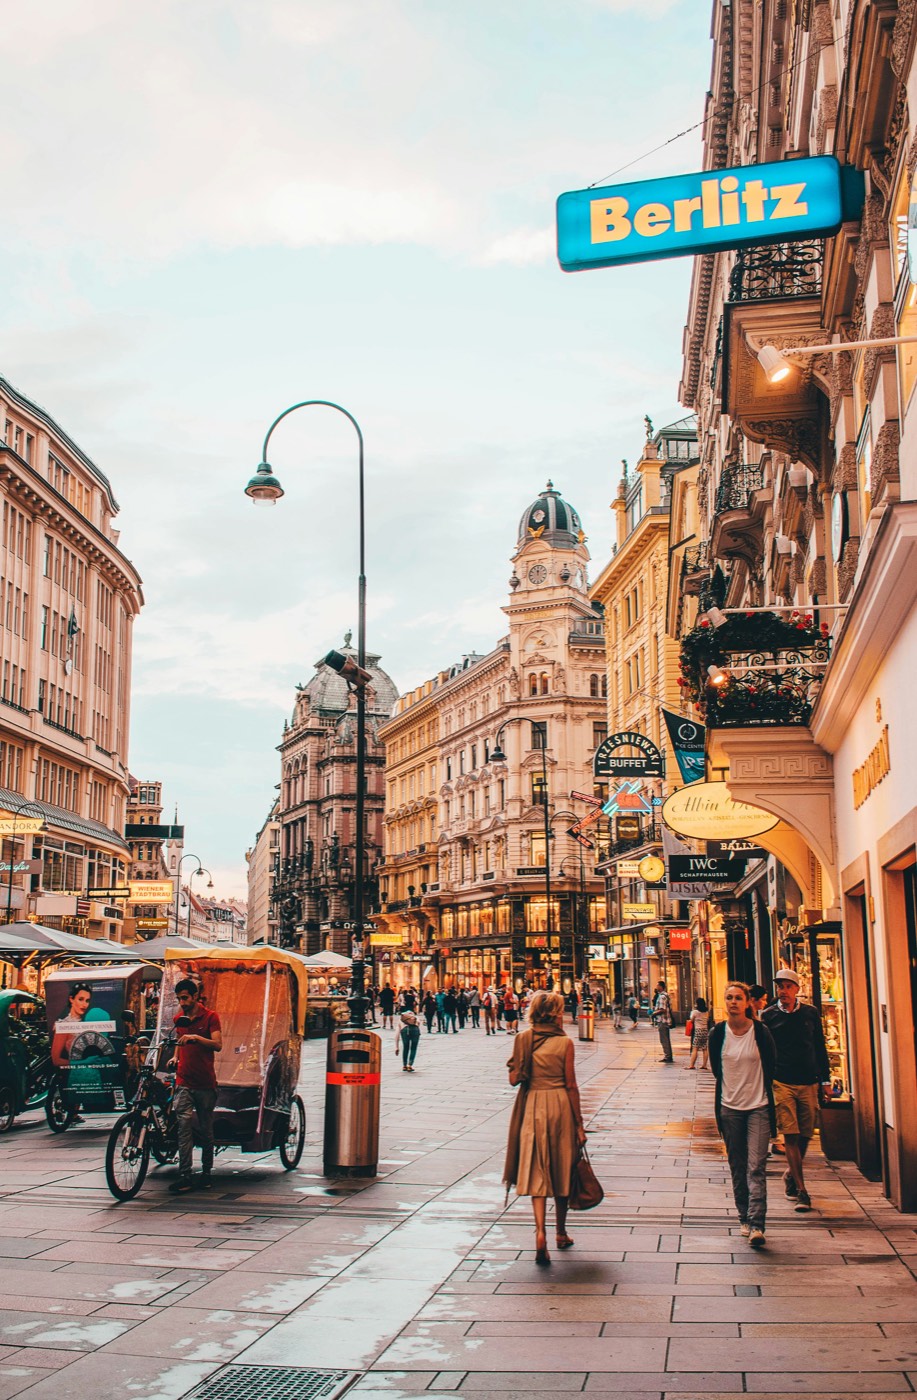
- Wars and crises shift migration – Vienna has always been a city of arrival and is still affordable among EU capitals.
- In the “migration pressure” scenario, development districts (22nd, 10th, 21st) grow fastest: up to +5.2% p.a. – rates derived from migration and supply data.
- A scenario is an open calculation you can redo yourself – not a prediction.
1. Why Vienna, why now?
Vienna is historically a city of arrival: after 1956, 1968, 1989, 2015 and since 2022 with Russia's war of aggression against Ukraine. According to Statistics Austria the city grew by more than 100,000 residents between 2020 and 2025 alone – mostly through international migration. At the same time Vienna remains comparatively affordable to buy among EU capitals (Paris, London, Munich, Zurich).
The “migration pressure” scenario asks: what happens to housing demand if geopolitical crises persist or escalate – the war in Ukraine, tensions around Iran and the Middle East, instability in neighboring regions?
2. The mechanics: from crisis to square-meter demand
The causal path has four stages, each with its own uncertainty:
| Stage | Mechanism | Uncertainty |
|---|---|---|
| 1. Movement | Crises create flight and relocation toward the EU | Duration and intensity of conflicts |
| 2. Destination | A safe, German-speaking capital with community networks attracts disproportionately | EU distribution policy, labor-market access |
| 3. Housing form | Rent first (immediately), ownership later (after 5–10 years) | Income growth, credit access |
| 4. Price effect | Demand concentrates on affordable districts with metro access | New construction as counterweight |
Important: capital migrates too. Wealthy households from crisis regions traditionally buy in “safe havens” – supporting the upper segment (1st, 13th, 19th), while displacement first tightens the rental market in affordable districts.
3. Winners and laggards – in the model
In the evidence-based model the Vienna-wide asking price grows 4.4% p.a. under migration pressure versus 3.0% in the baseline (base: institutional forecasts 2026; delta derived from migration and supply data). The spread across districts is the real story:
| District | Baseline | Migration pressure | Reason |
|---|---|---|---|
| 1100 Favoriten | +3.4% | +5.1% | Lowest entry on U1/main station, Rothneusiedl |
| 1220 Donaustadt | +3.5% | +5.2% | Seestadt, land reserves |
| 1200 Brigittenau | +3.1% | +4.6% | Nordwestbahnhof development |
| 1010 Innere Stadt | +2.6% | +3.8% | Capital inflow yes, volume effect hardly |
The logic: inflow under budget pressure seeks the cheapest supply with transit access – which is why development districts react strongest. Visible on the interactive map as the forecast layer.
4. Recalculate instead of believing
Example Favoriten, 70 m², researched reference values: asking price today 4,350 €/m² ≈ €304,500. Under migration pressure (+5.1% p.a.) that would be ≈ €371,500 by 2030 – ≈ €348,000 in the baseline. The ≈€23,500 difference is the price of the assumption, not of the truth. Run it with your own numbers →
Conclusion
Geopolitics is the hardest price driver to forecast – and the one that shaped Vienna most over the past century. Whoever buys or sells should know the scenarios, but anchor decisions in their own numbers, not in headlines.
Source structure of the scenario
- Statistics Austria – population and migration statistics (official context)
- UNHCR / BMI – displacement and asylum statistics (official context)
- OeNB – real-estate market reports (official context)
- City of Vienna – urban development plan, Rothneusiedl/Nordwestbahnhof (official context)
- Wohni researched reference values – illustrative asking medians and scenario assumptions